Designing a Data Grid
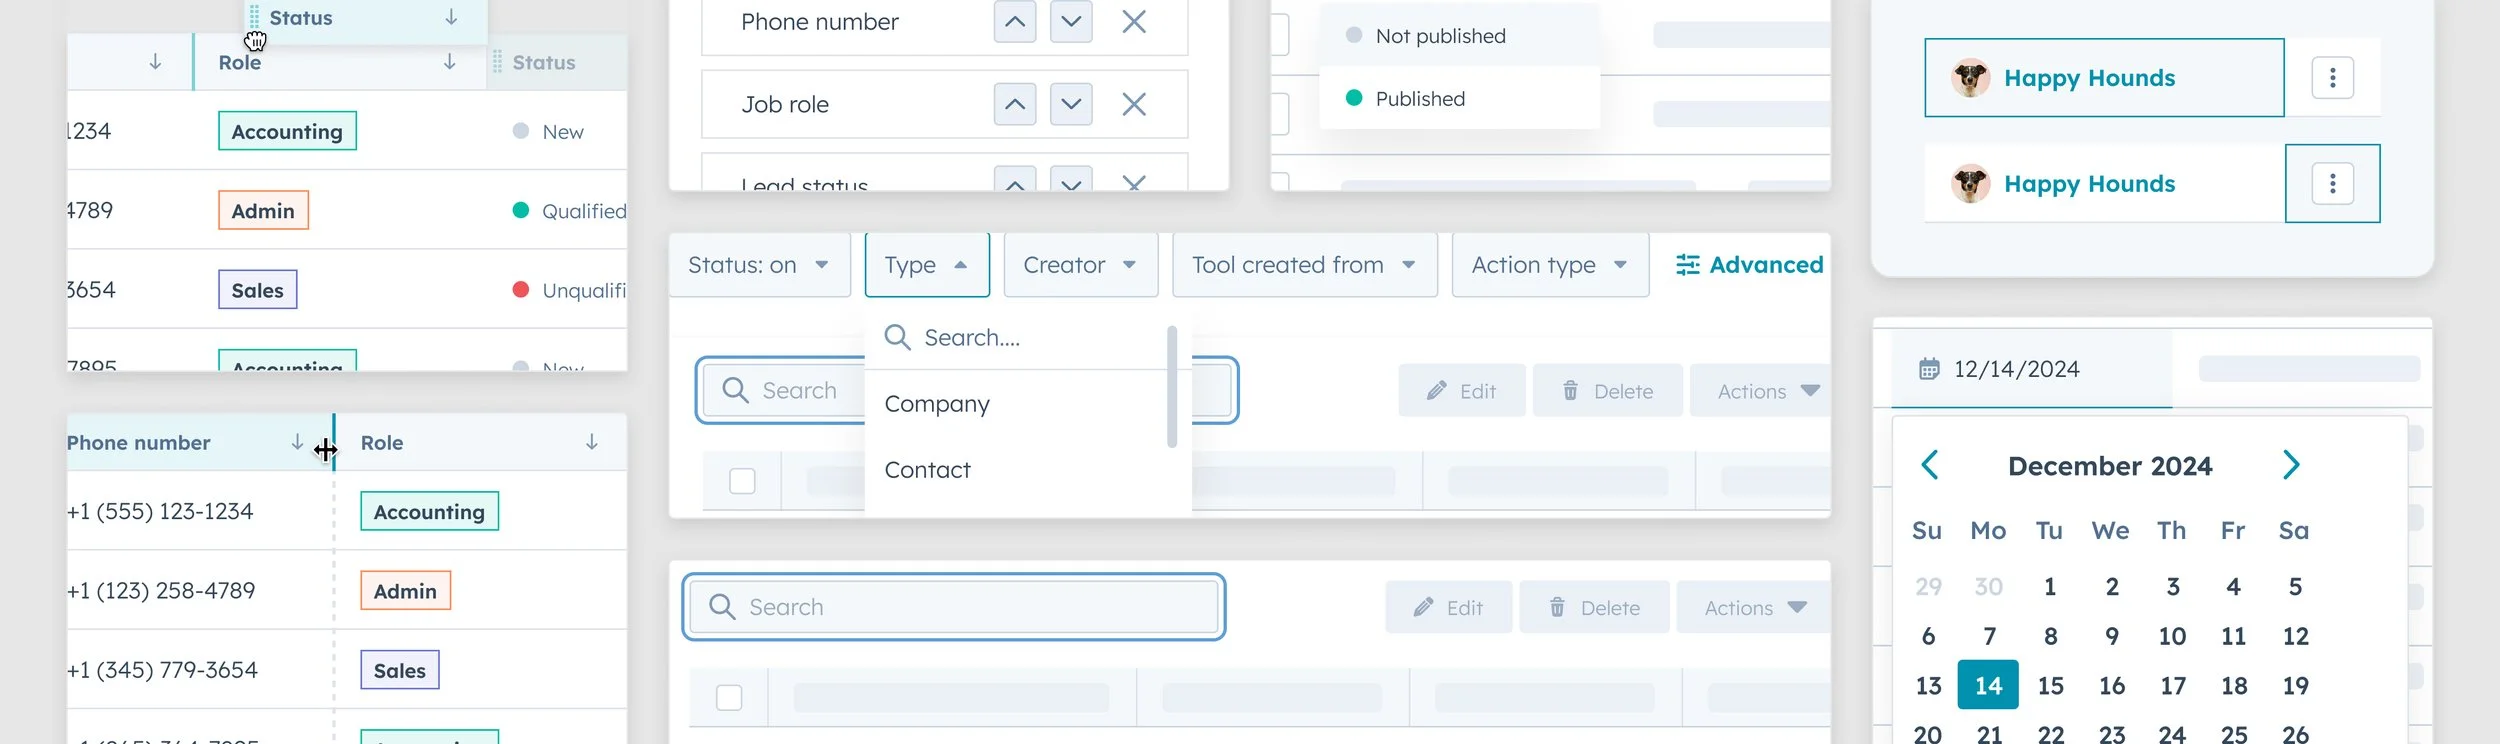
Tables are complicated. They’re pervasive in HubSpot. Within HubSpot, teams created their own data grids, leading to inconsistencies throughout the platform. I set out to create a centralized component that took care of all features horizontally needed across the platform.
Duration
HubSpot, 2025
Role
Senior Product Designer, DRI
The Problem
There’s a lack of clarity between what exists in the Canvas design system and what has been custom built by other teams. This has resulted in inconsistent behaviors and a lack of ownership and maintenance. These inconsistencies created a confusing mental model for the user and builders lacked a single source to access the component.
My Discovery Process
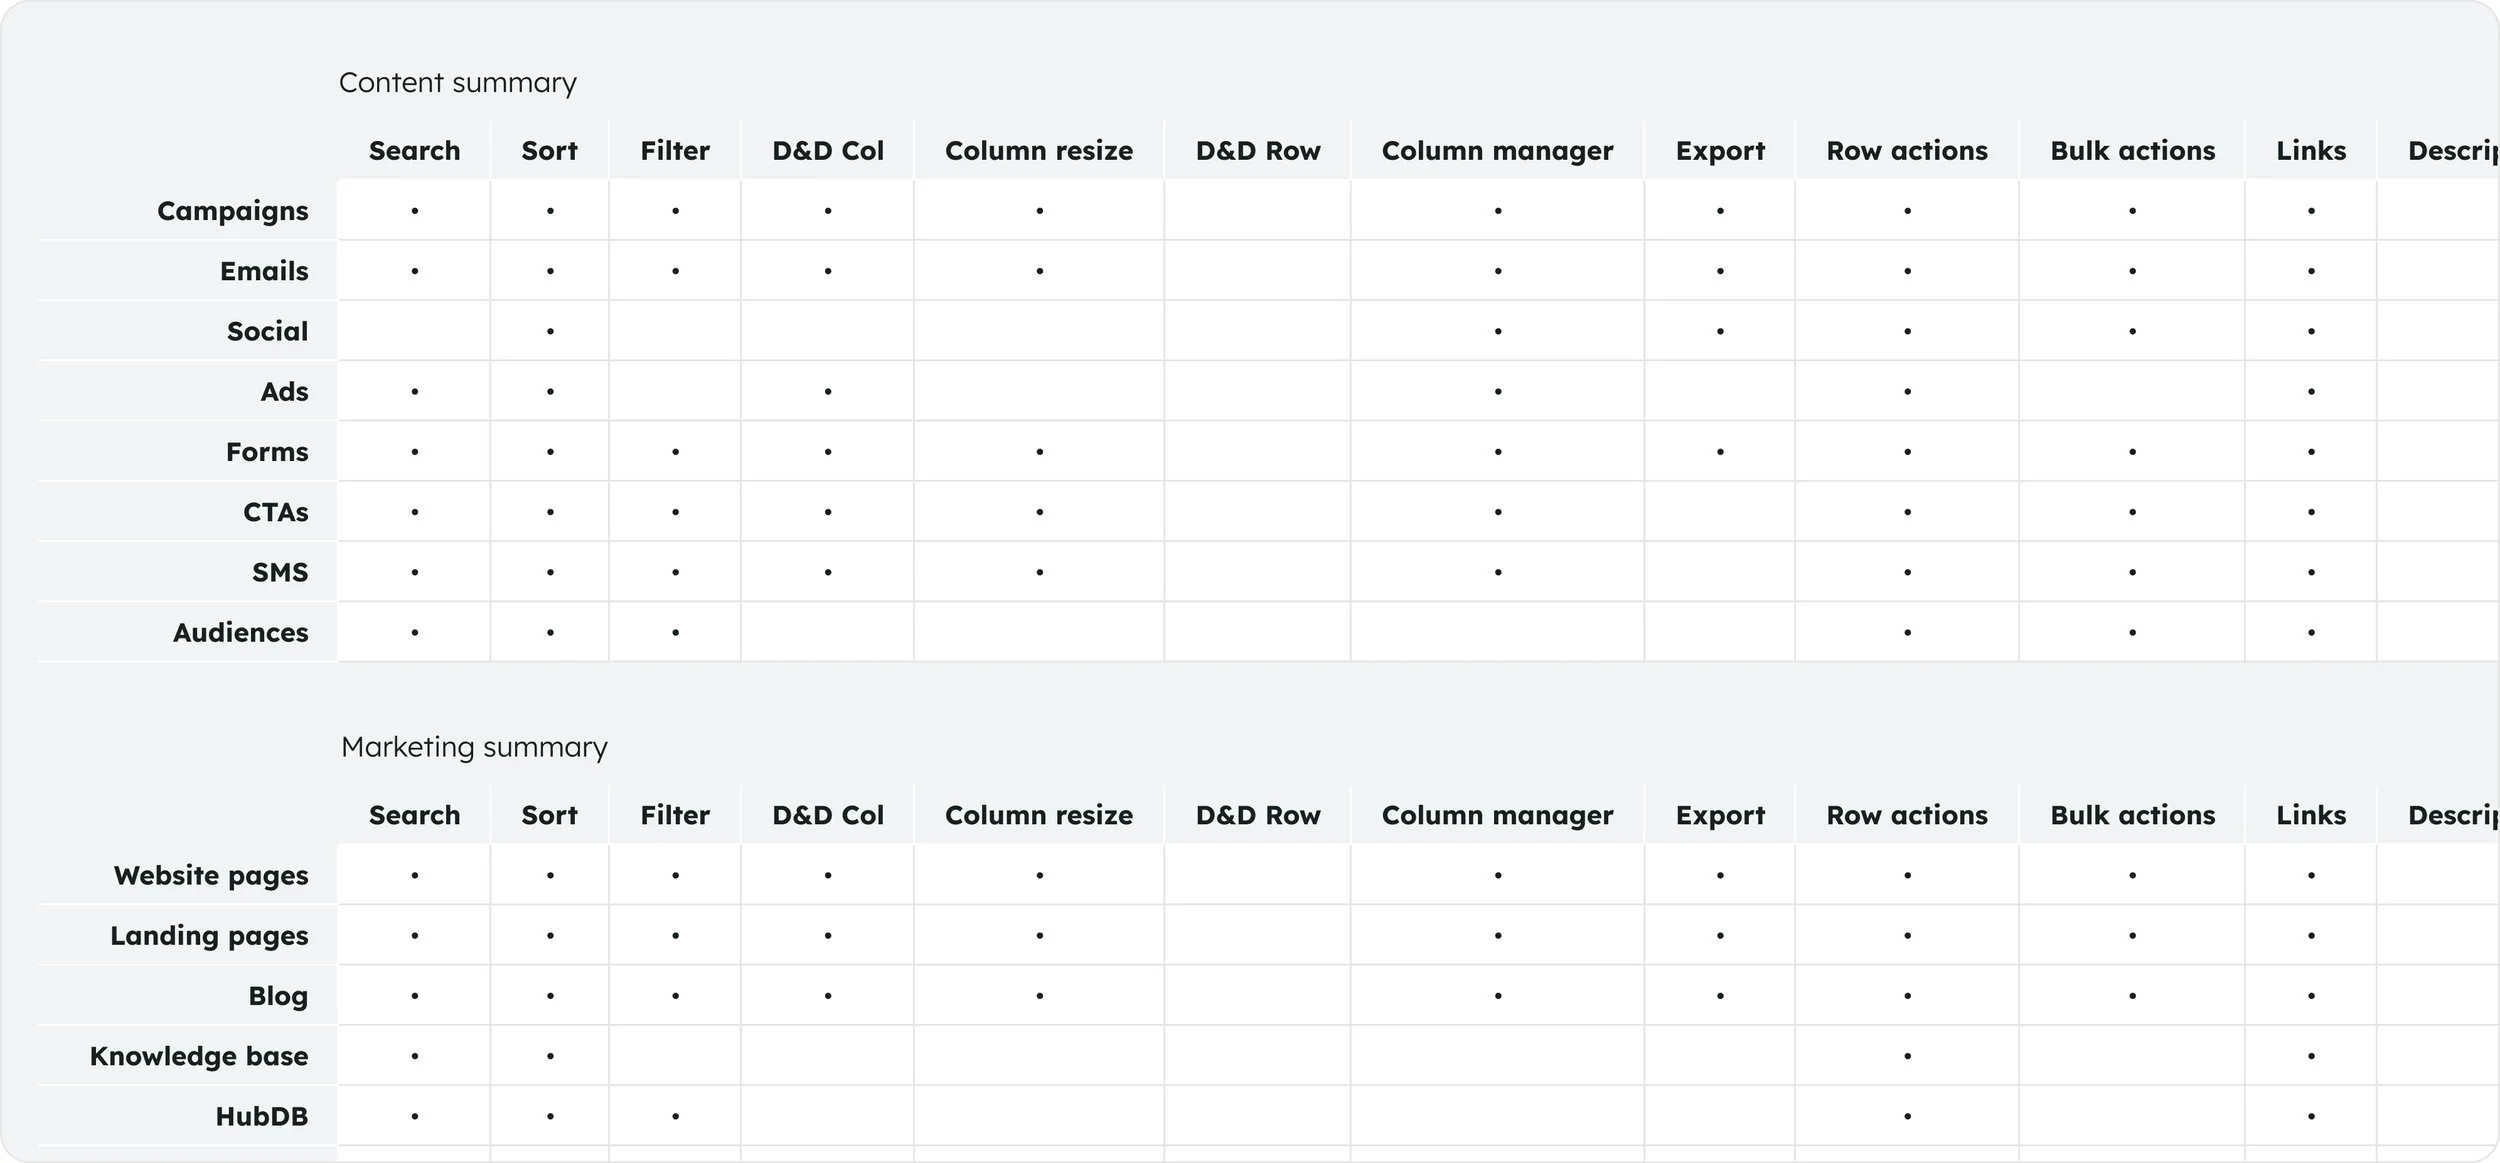
To begin this work, I needed to have a full understanding of how tables are used throughout the product and account for all features used within the table. I completed an internal audit and documented each table feature. I also explored other design systems to discover industry standards.
Creating a Feature Roadmap
Next, I wrote a project requirements brief including an iterative roadmap for completion. This document helped everyone working on the project stay aligned and guided the general phasing of design work so we could deliver functionality at each phase. I later worked with the engineering lead on the project to expand on this and write a more detailed feature requirement list.
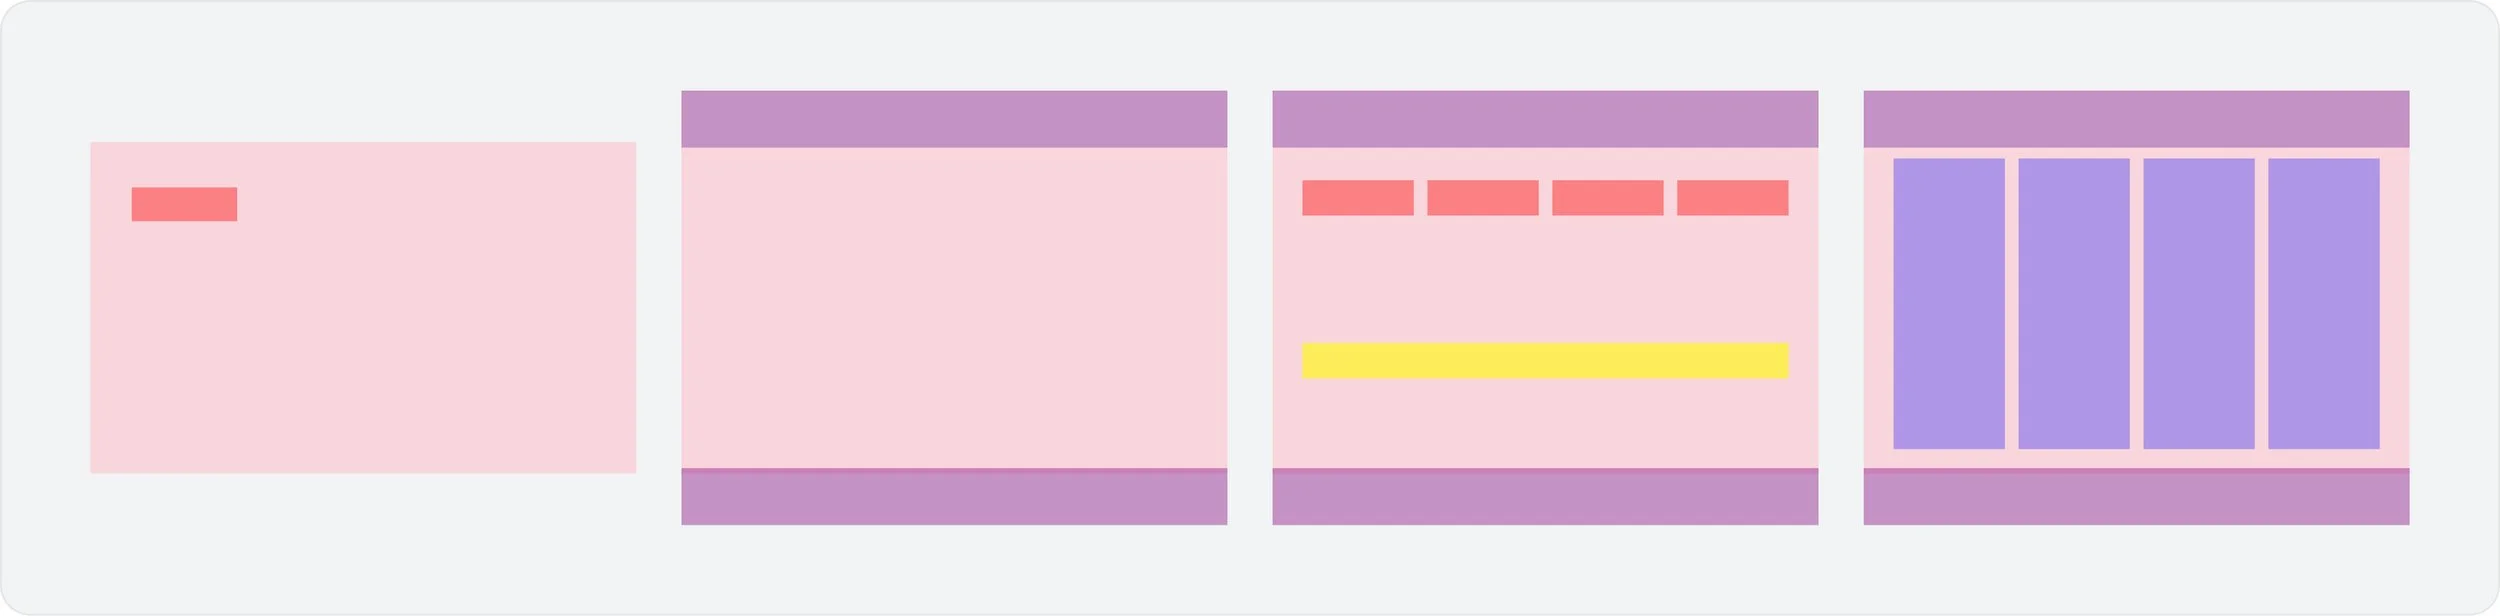
I planned a phased approach—first creating the foundations of the table, then the chrome, followed by row actions and column management.
Cross Team Collaboration
Designing a modernized table component required building a relationship with the CRM team — the largest consumer of the data grid with some unique requirements. I regularly met with the CRM design manager and CRM Data Grid designer to align on feature needs and approach. My objectives were to gain an understanding of their core user and define a set of Data Grid features that would meet the horizontal platform needs and CRM needs.
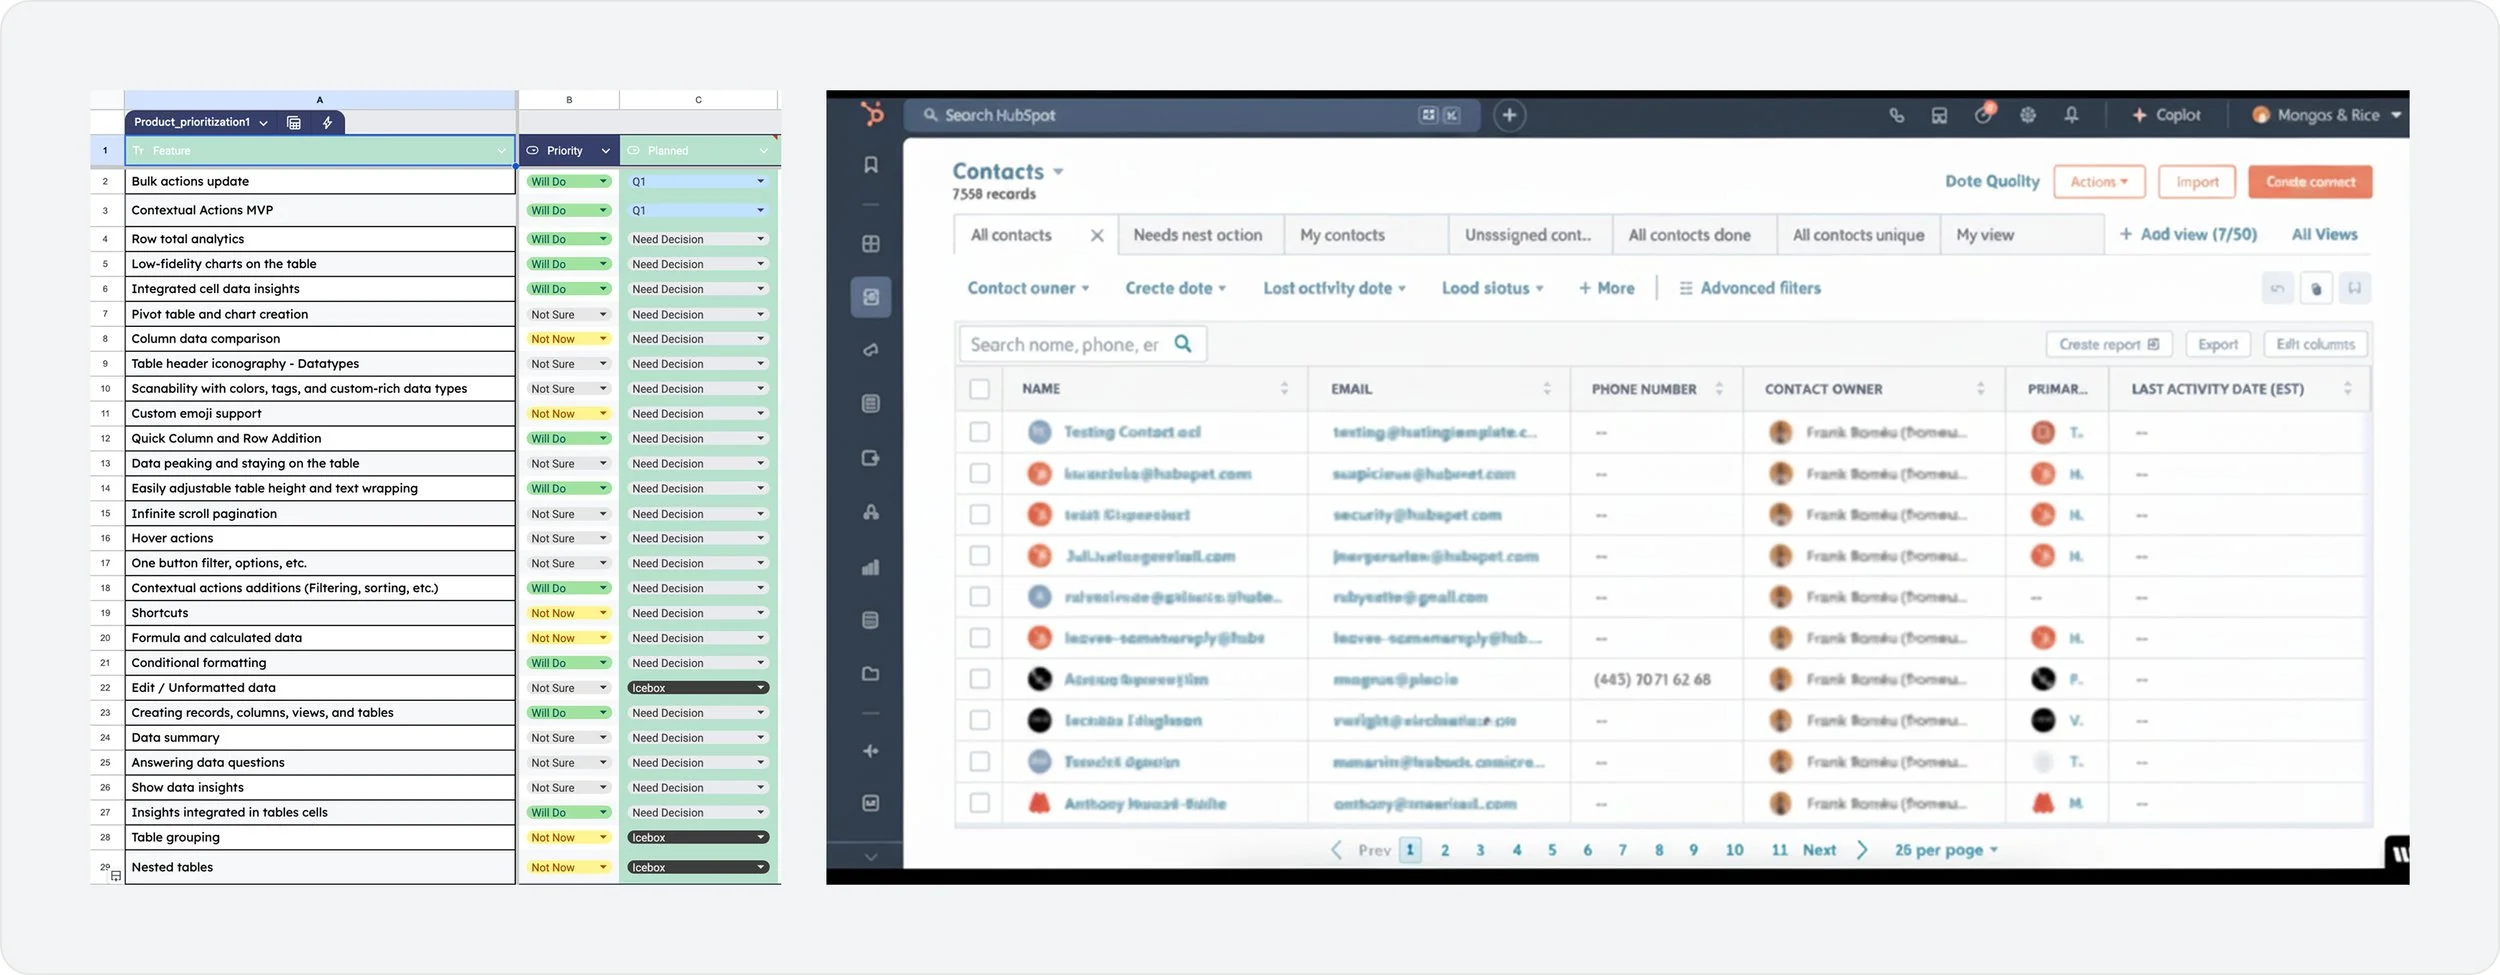
The CRM team was planning to redesign their data grid. I worked with the team to incorporate their roadmap and needs into the upcoming design system data grid.
Defining Solutions Through Research
During the collaboration there were moments I had to lead decision-making based on unbiased research. For example, in my initial designs, the behavior of row-level actions was an industry-standard interaction—a fixed right column populated with a set of actions for each row.
This was quite different from what was currently in product — a button that only showed on hover in the first column. This design is plagued with accessibility and UX issues. Despite this, the CRM team insisted we retain this pattern because it better served their users than the fixed right column would.
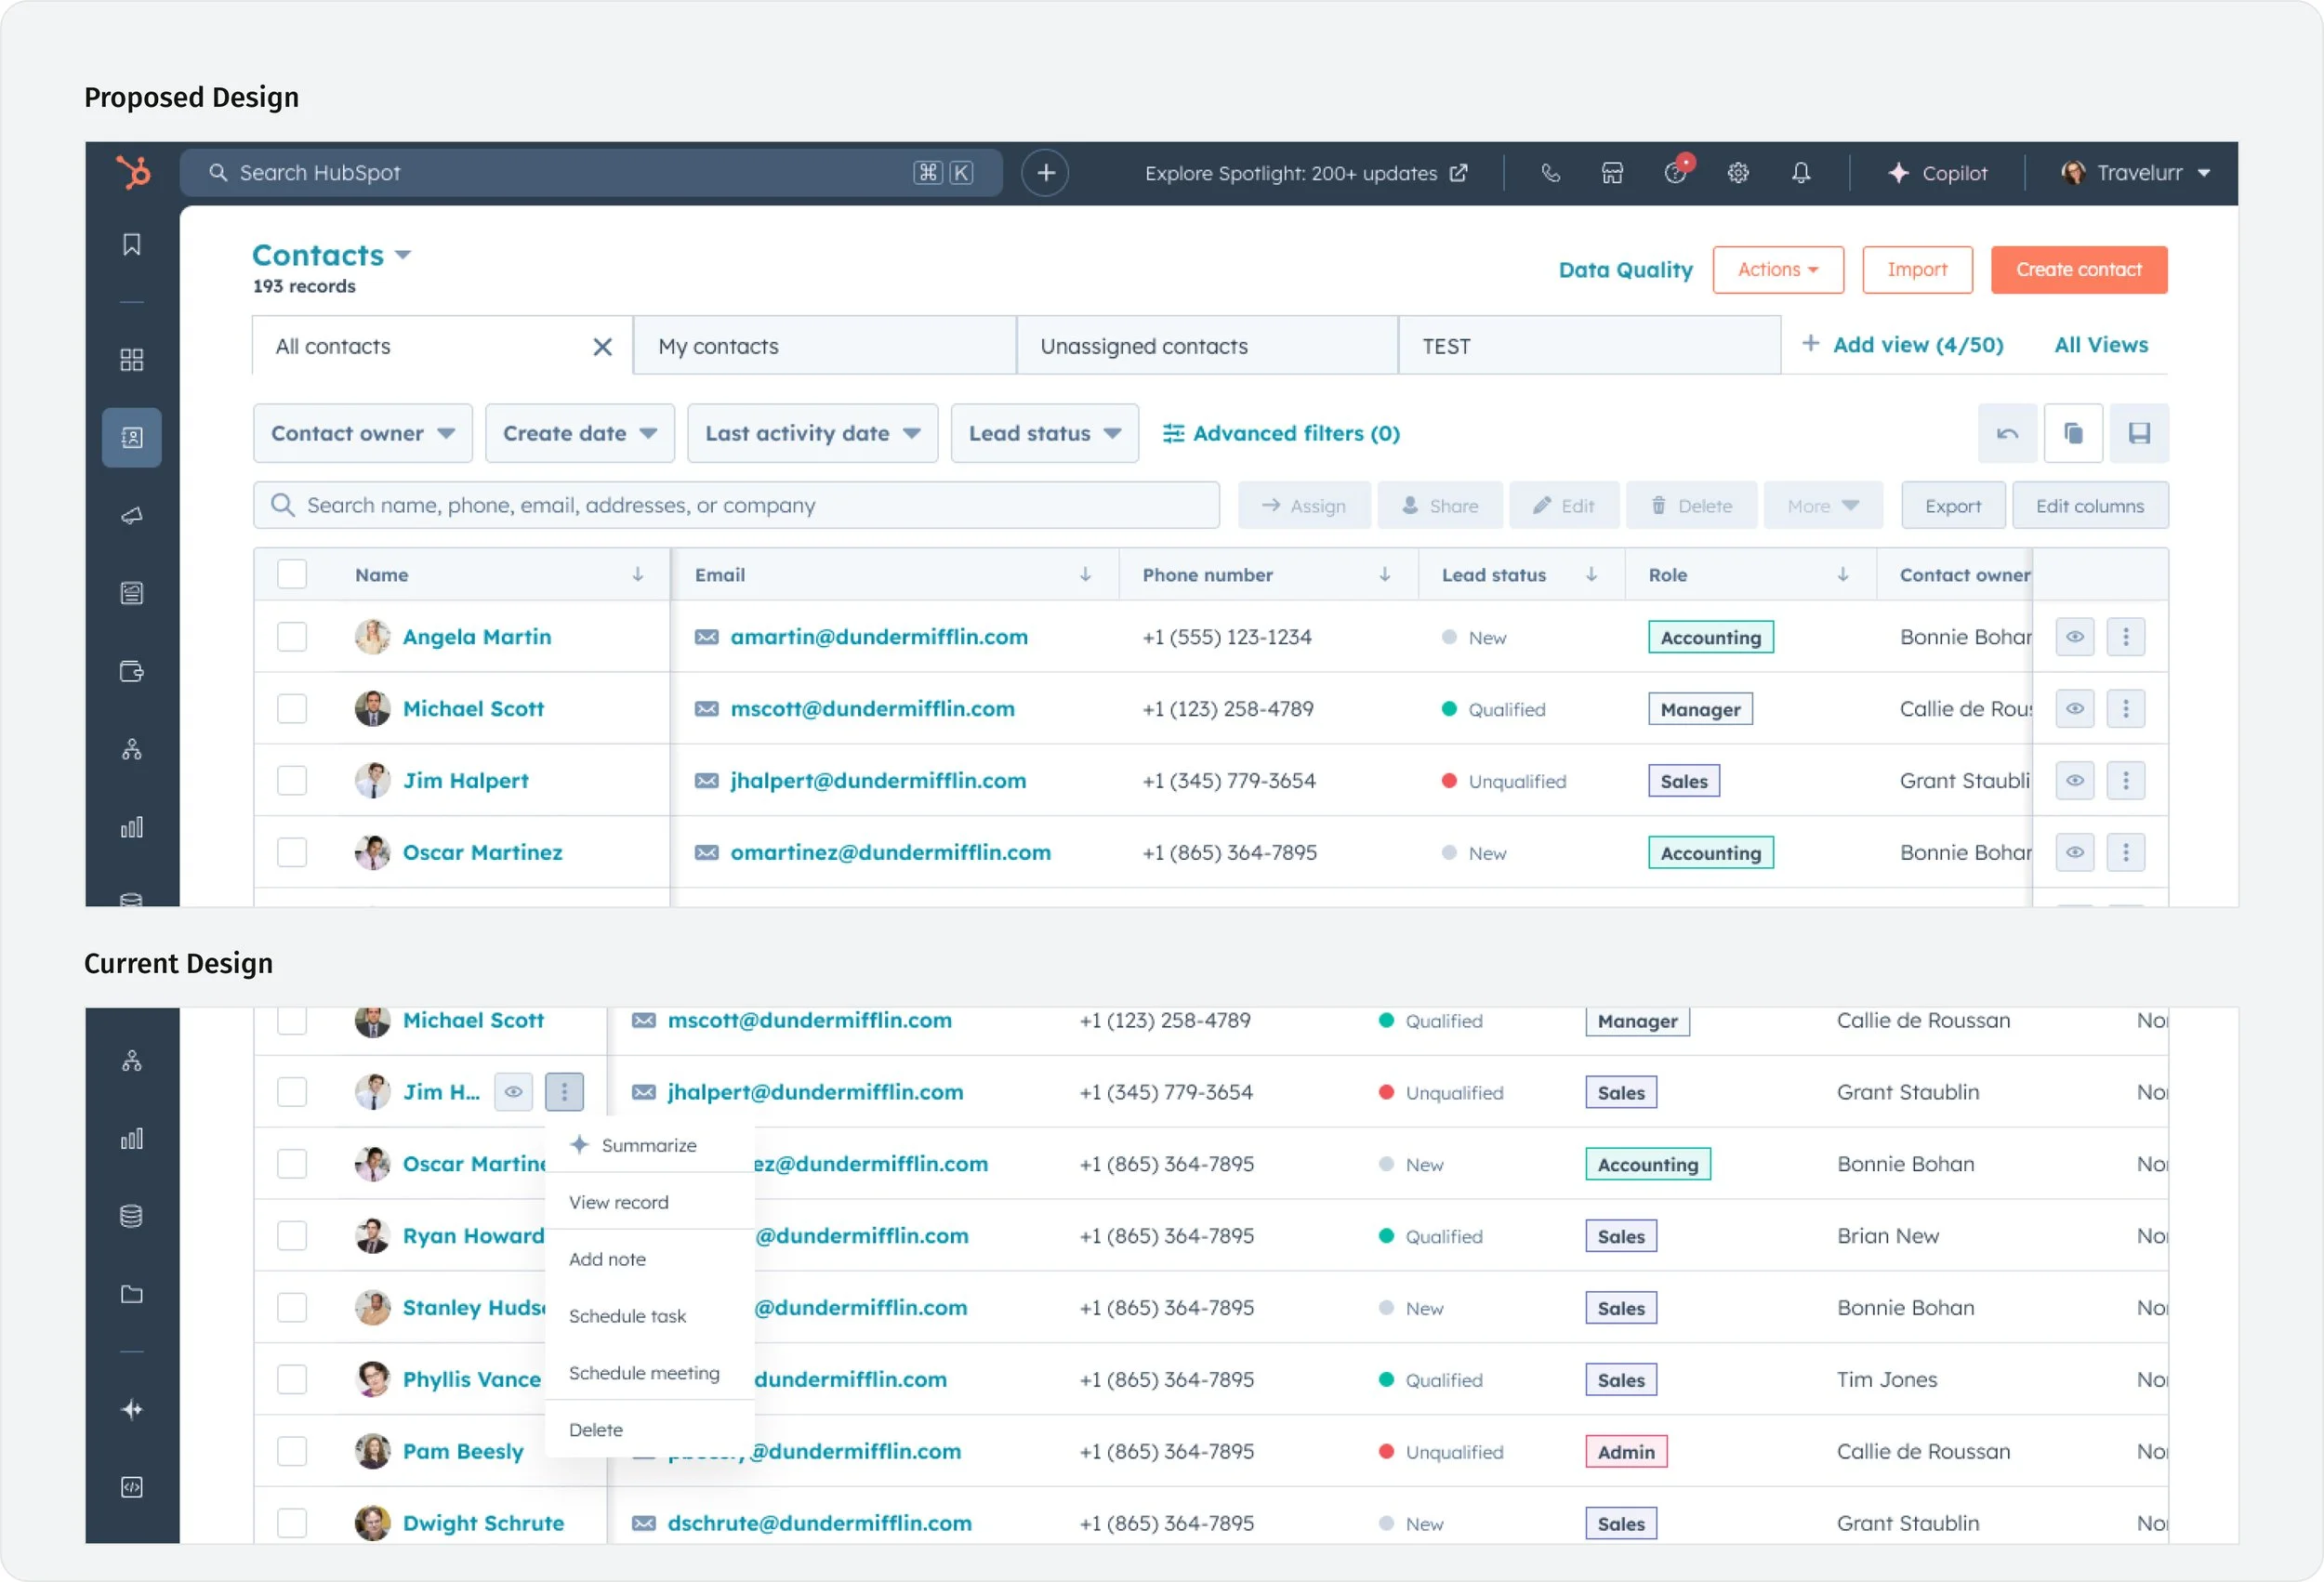
My proposed solution called for a fixed actions column on the right. The current pattern included a hover state that caused some accessibility issues.
Finding a Resolution
I knew I needed to resolve this issue with real data. I conducted an unmoderated usability study on MeasureU to see how three different designs of row-level actions performed. I then synthesized these findings and presented them to the working group with a recommendation that satisfied both teams and was validated by users. I navigated cross-team politics by building trust and was able to get the clarity we needed to move forward.
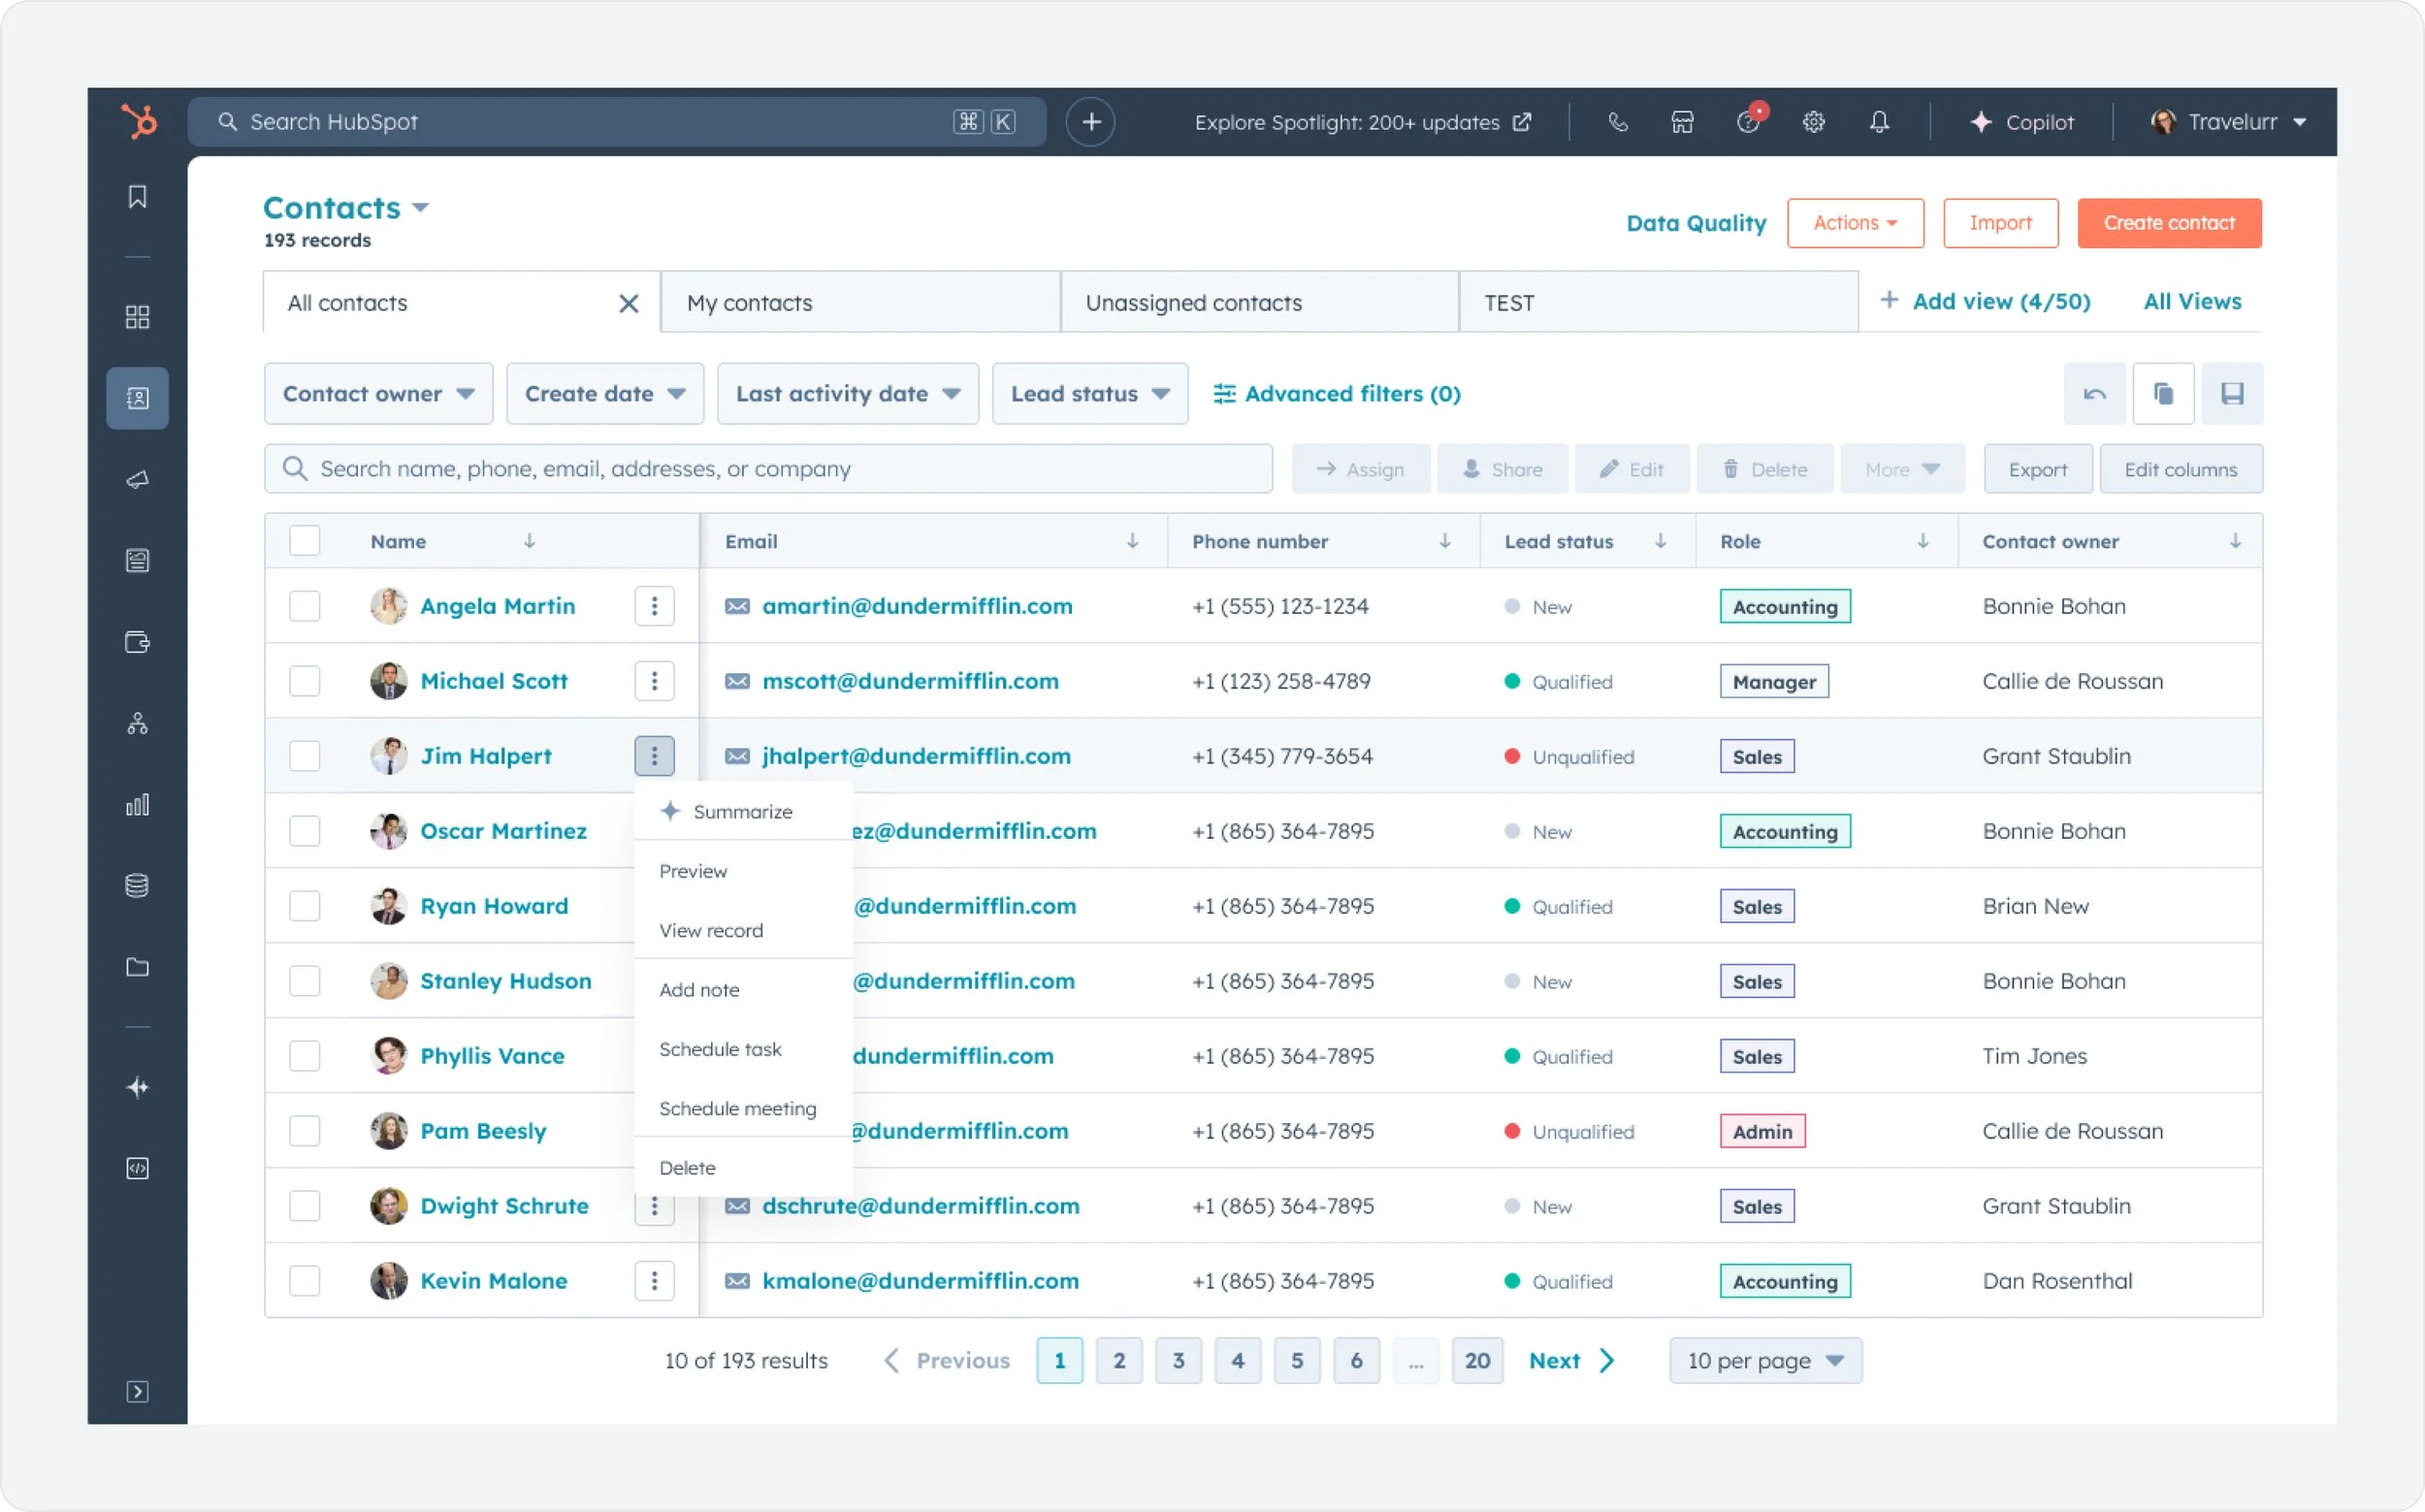
I created a new pattern that met the needs of both stakeholders and validated it through user testing.
Delivering an MVP
Once teams were aligned, I continued iterating and incorporating user feedback gained through prototyping and user testing into the designs. I worked closely with engineering to ensure interactions were being built as designed. Not only did I meet regularly with engineering to have design reviews, but I also provided detailed specifications.
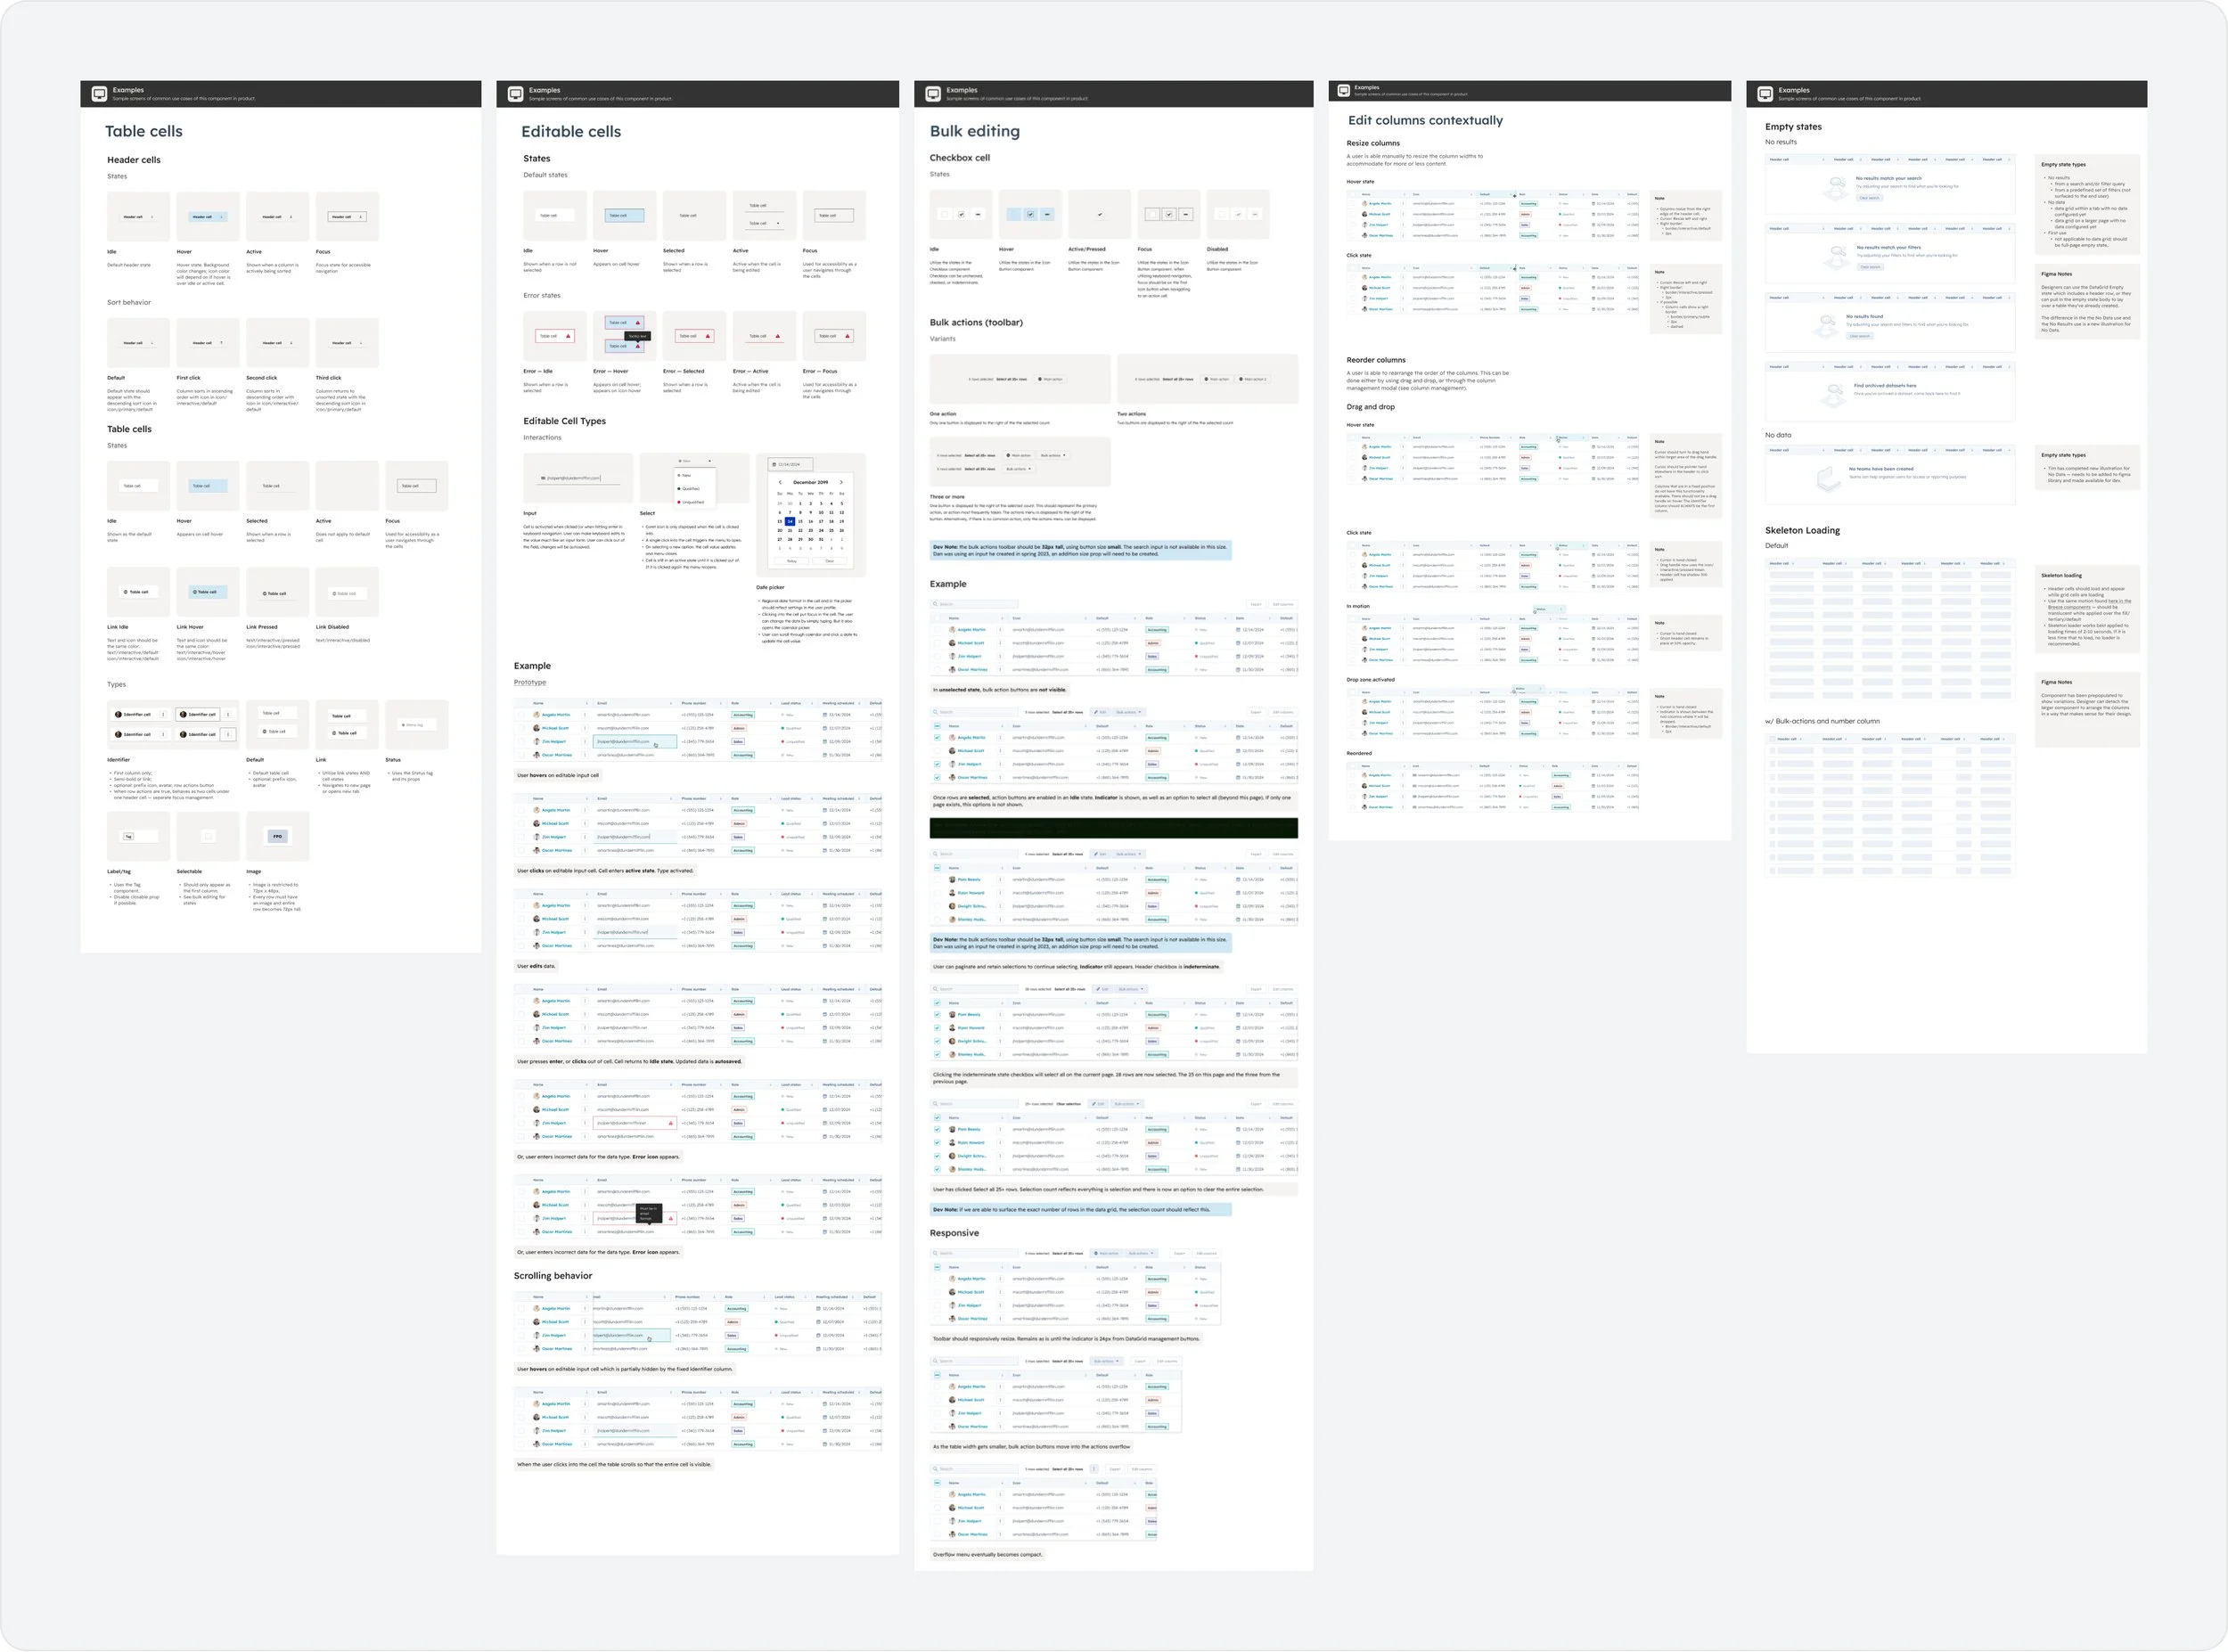
Detailed specs of each data grid interaction
Writing Usage Documenation
As development got further along, I also wrote usage documentation that would be published to our newly created documentation site. This was the first documented pattern for modernized components and would set the stage of what was to come in helping bring consistency for the end user, but also make building easier for our designers.
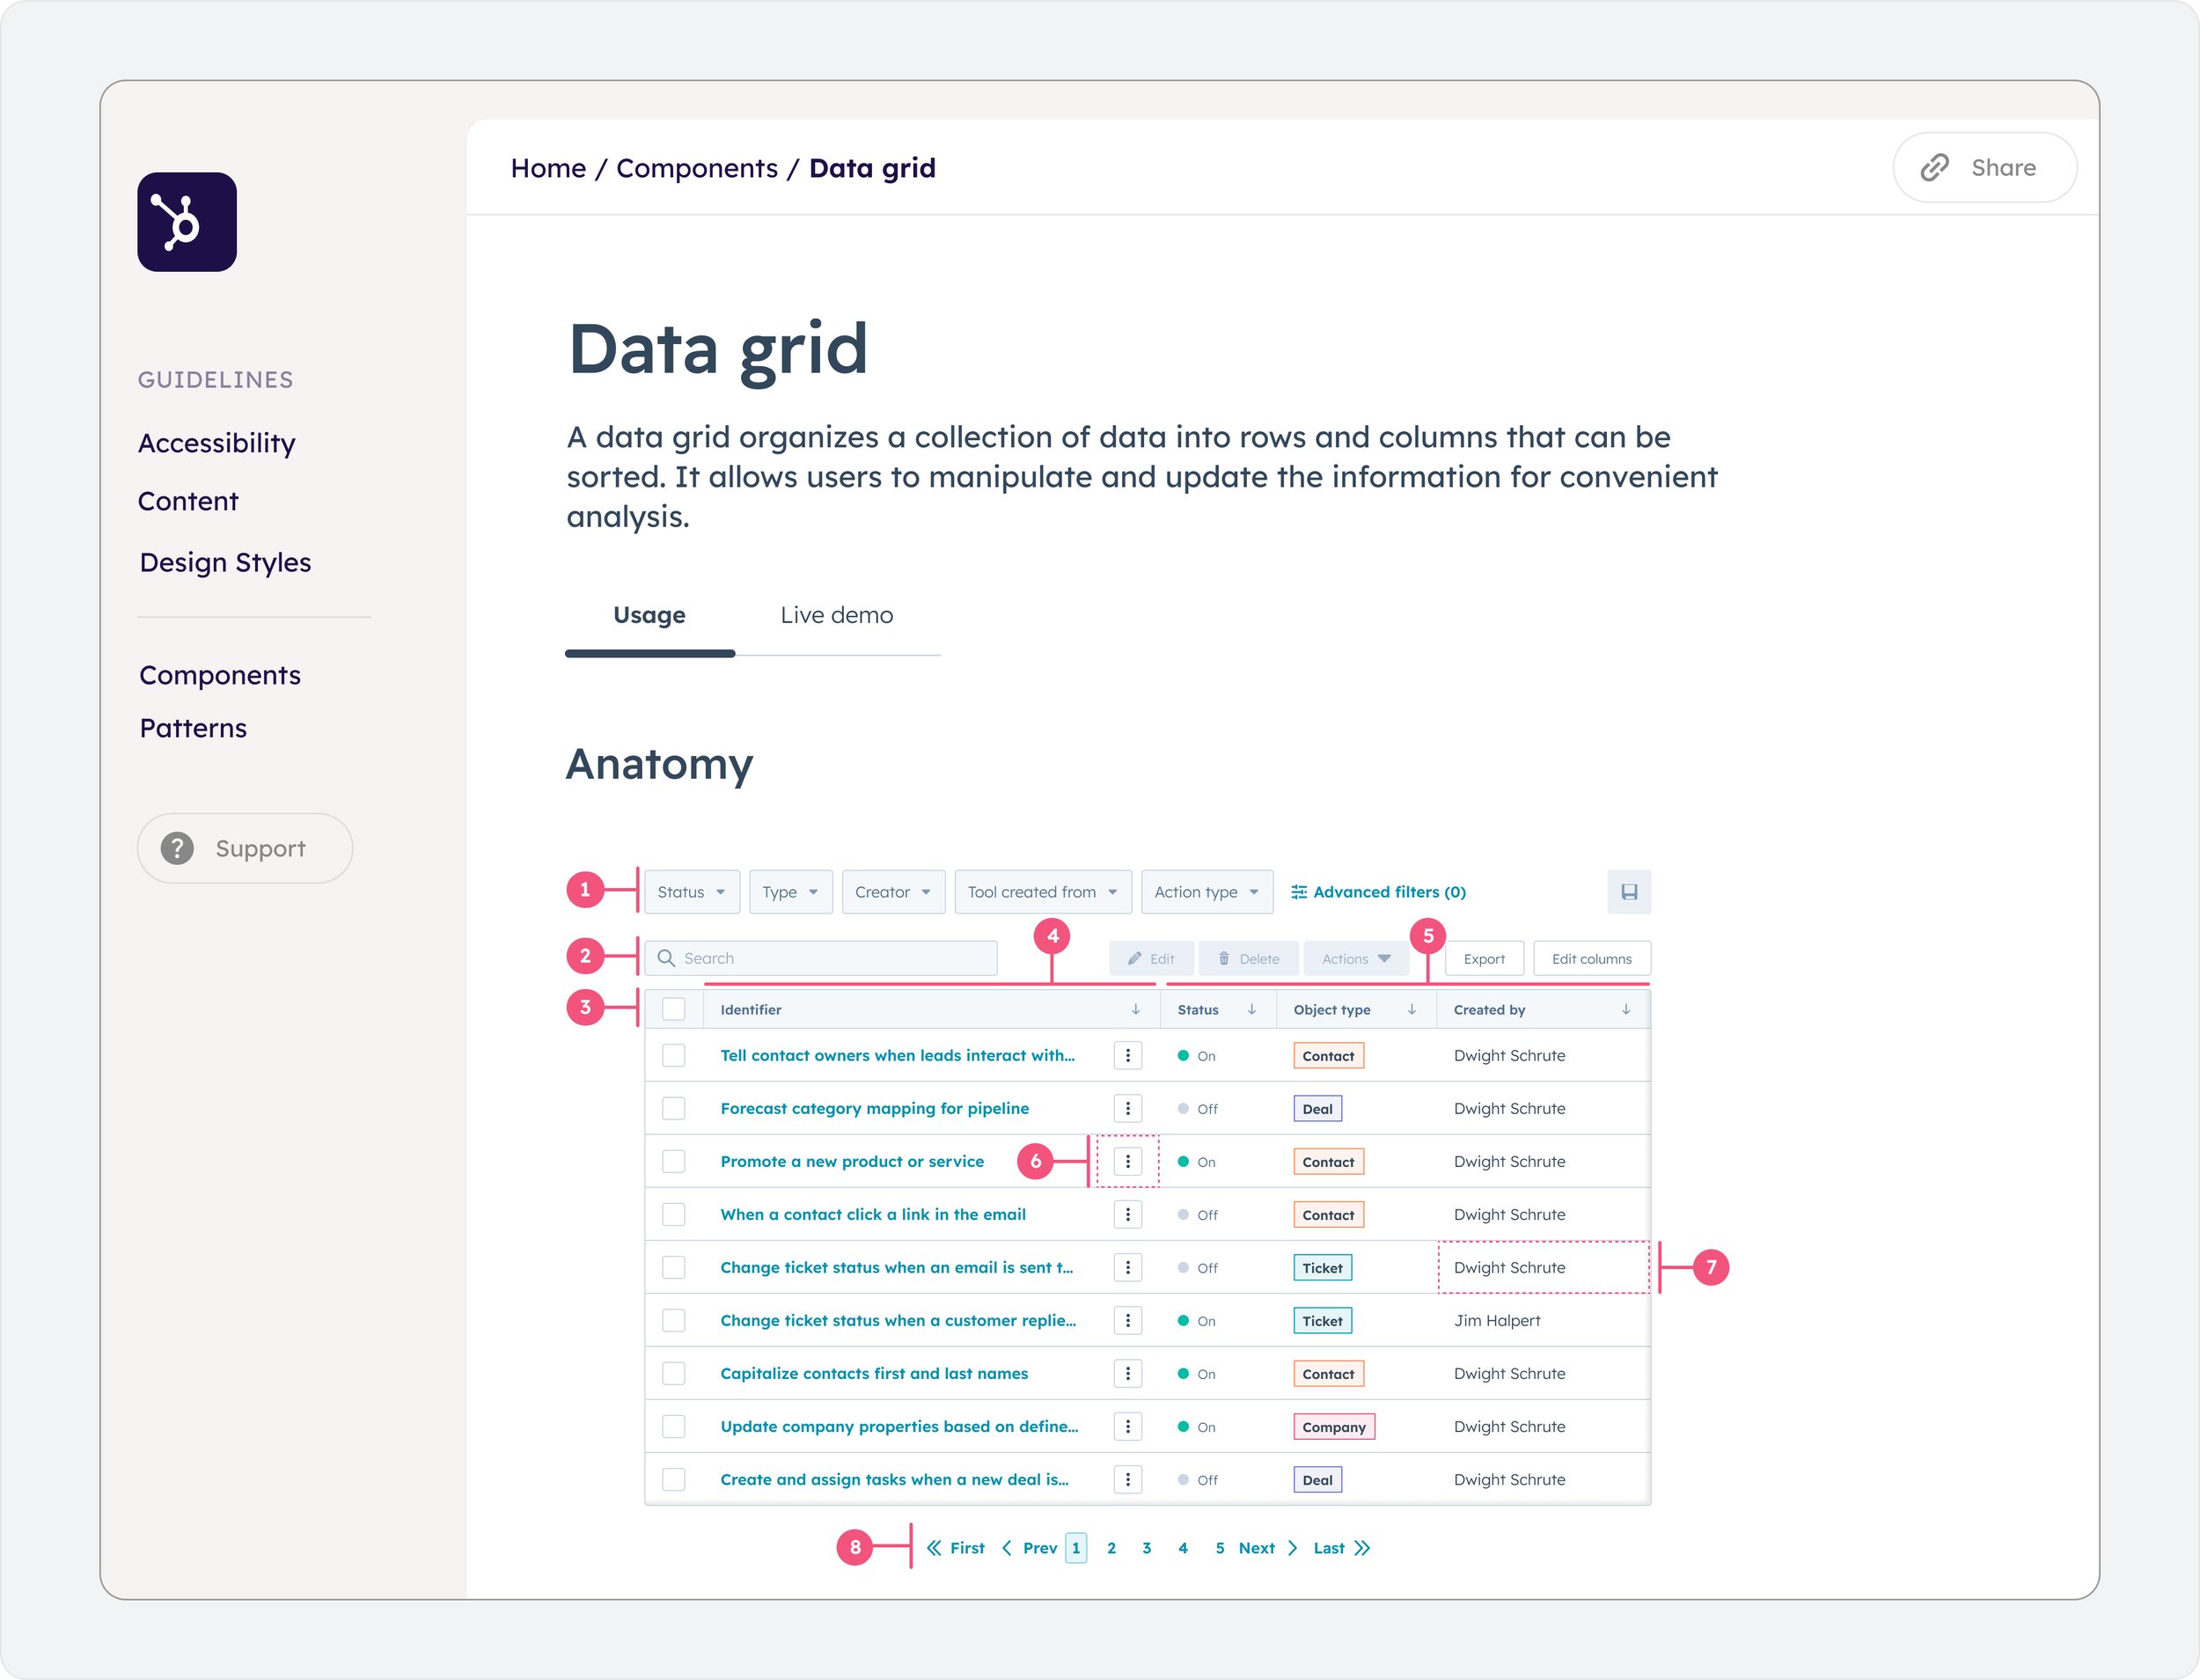
I wrote all of the usage documentation for the new data grid including states, patterns, dos and don’ts.